How to find Trends with Chart Reading

Charts (or Chart Pattern) is a combination of different changes in a price of a security over a given period, It allows the Trader to take leveraged position ny predicting future price movement on the basis of existing(or Past) Price Action
Chart Pattern can be divided into 2 Parts :-
Continuation Chart Pattern & Reversal Pattern
Lets discuss them in a detail
Continuation Pattern happens in the middle of original Trend, after taking a pause Index or stock start moving in the original Direction. Refer below given image( we will discuss all possible types of continuation pattern in Next question)

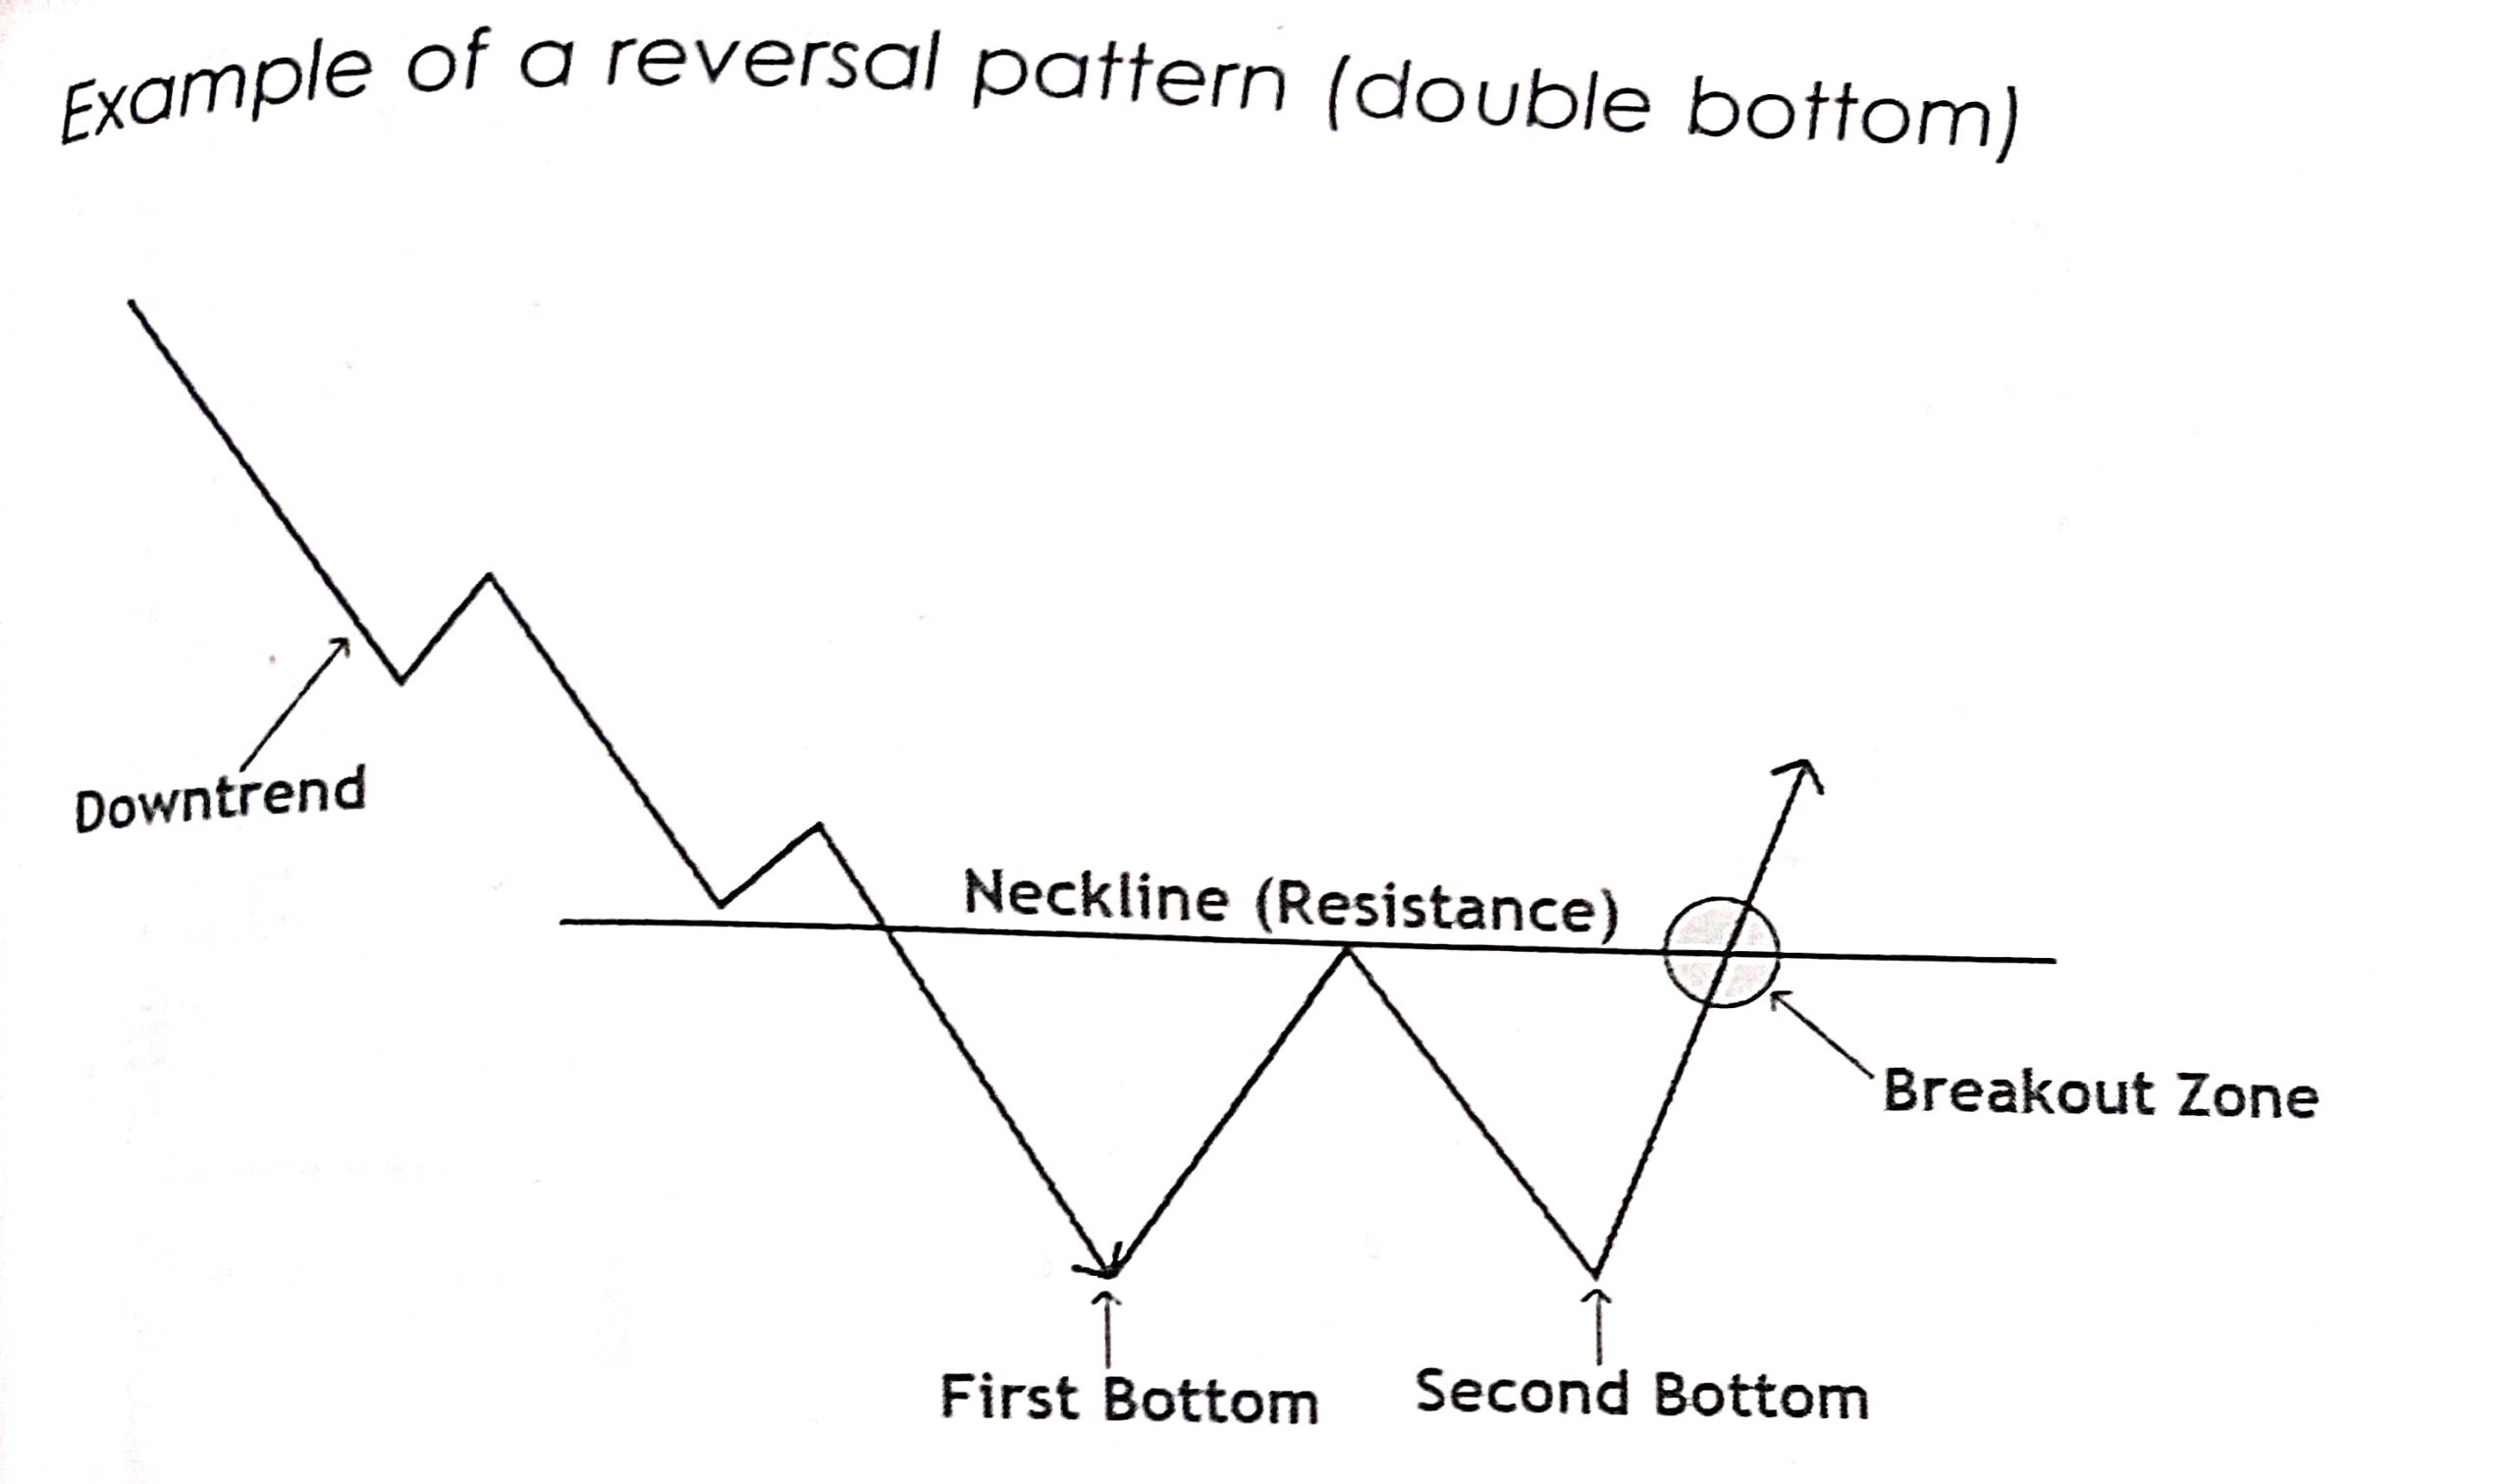
Lets discuss second category of Chart pattern,Reversal Pattern it implies change in Trend. In short Bear or Bull loosing their grip and original Trend is in danger now Trader with existing position will close their position and will prefer to take contra(or opposite) Psoition. Refer below given SBI Chart
Price Action movemement can be categorised into 2 Parts :-
Trending (Uptrend/Downtrend) and Sideway(Ranging)
Lets them discuss in details
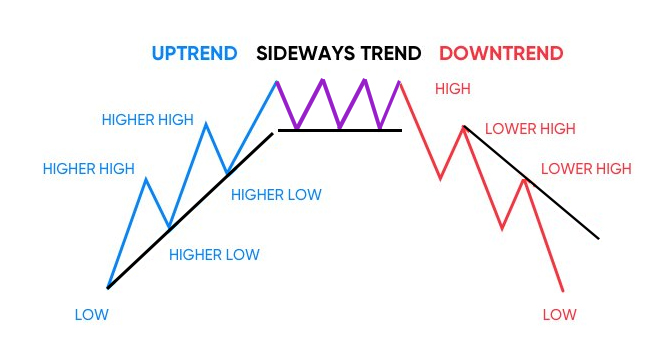
Uptrend/Downtrend # If security is closes either higher or lower (in any given Period) is said to be Trending, Positive move is categorised as UPTREND & Negative Move is categorised as DOWNTREND
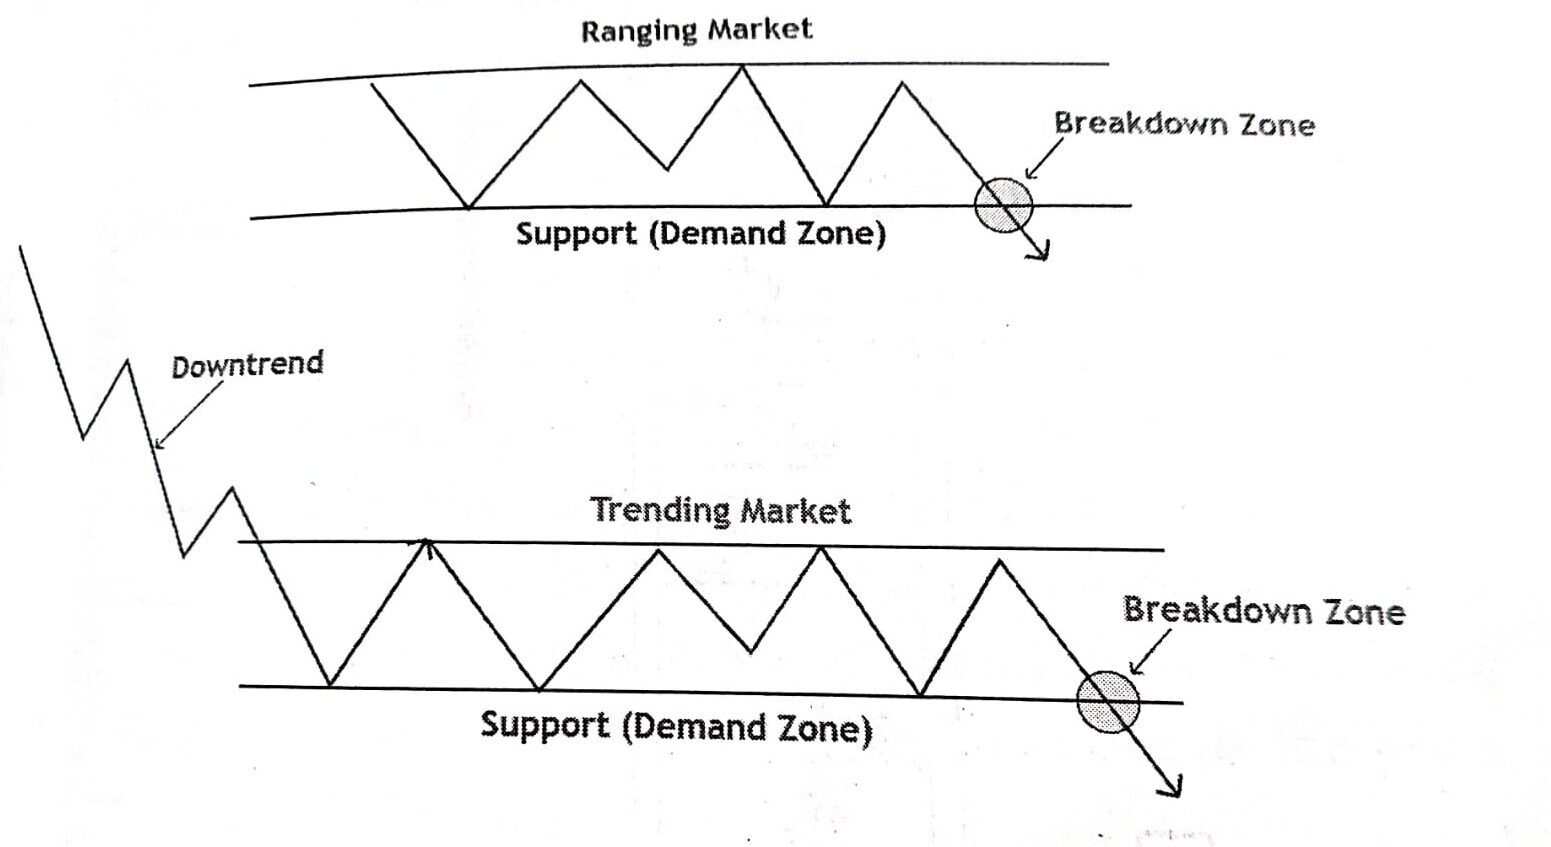
Sideway/Ranging # If Security is stuck in range between high & low (Resistance / Support ) this kind of Price Action broadly known as Sideway/Ranging Market, these consolidation in Price Action finally results into Trending Move
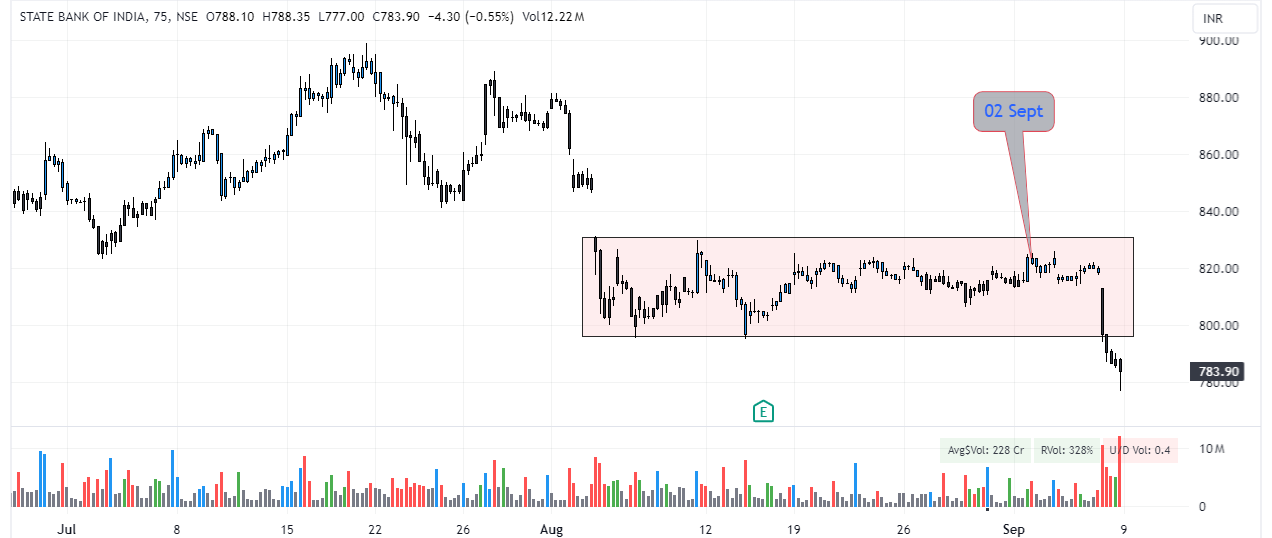
Breakout is Potential Trading opportunity on the Long side it occurs when Price climbs above the Resistance Level on the other hand if Price starts trading below the support level its a shorting opportunity and broadly known as Breakdown
Conditions for Genuine Breakout/Breakdown
- Strong volume,
- Significant Support/ Resistance,
- Breakout in Line with Long Term Trends,
- Low volume before breakout is a good sign,
- consolidation or sideway price action also plays an important role
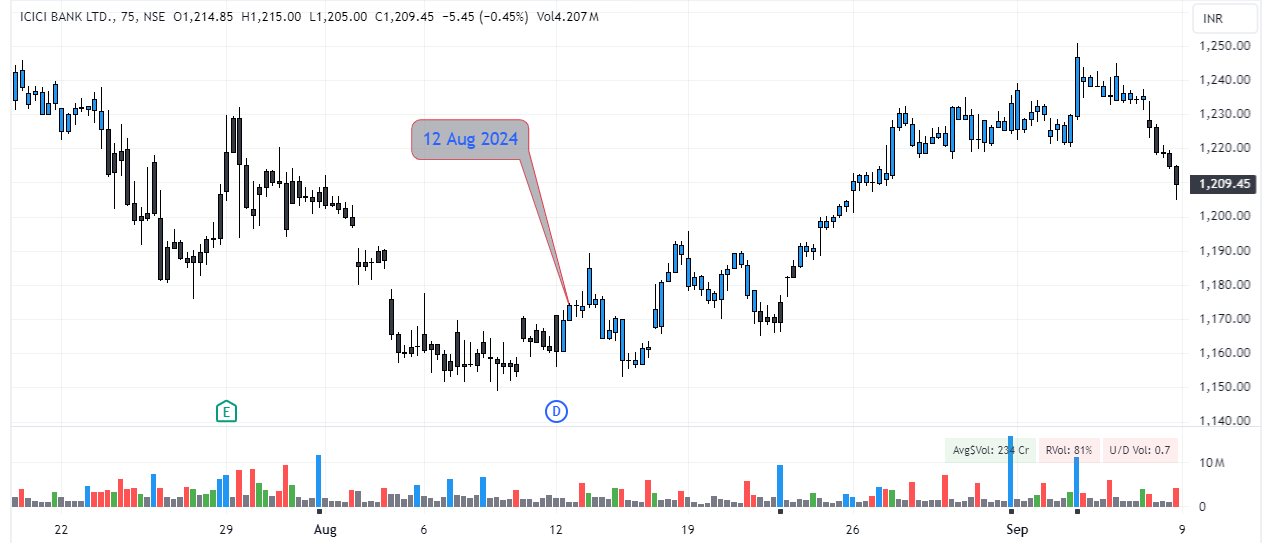
ICICI Bank (75 Min Chart) between 12 Aug to 30 Aug
After consolidation stock after making Lower Low stock made a high ( Breakout), Entered on 12 Aug ( after breakout confirmation) confirmed almost all the above given conditions
SBI (75 Min Chart) between 02 Sept to 06 Sept
Lets discuss Support & Resistance in detail
- Support is a level where Stock take a rest(stop) for a while from there it takes a reversal
- If support is broken due to any reason stock try to find new supporting level at much lower point
- In reversal form of Trading, Trader Prefer to take a position at lower level and prefer to sell at resistance Zone
- If support is Broken and Stock start making Lower Low position this will be the time to take short position in the stocks ( Refer below given chart)
- Resistance is just opposite to the Support and its belived that selling pressure will come around this level
- If Resistance is broken due to any reason stock try to find new Resistance level at much higher point
- In reversal form of Trading, Trader Prefer to take a position at higher level and prefer to buy at support Zone
- If Resistance is Broken and Stock start making Higher High position this will be the time to take Long position in the stocks ( Refer below given chart)

After going through all the above discussion now we know that Trader main concern is to find Trend of the Stock and No doubt Trend is the real Friend of any Trader.
Gaps also plays an important role in enhancing (on analysis) of the Trend
Gap up in the stock or Index shows that People are impatient to buy and on the other hand Gap down in the Stock or Index shows that the People are impatient to sell
Lets discuss the Type of Gaps in detail :-
- Common Gap
- Breakaway Gap
- Runaway Gap
- Ehaustion Gap
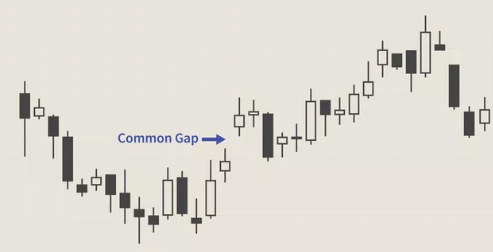
Common Gaps are the outcome of routine Trading Activity usually these gaps occurs close fast
Major Reaons for these kind of Gaps :-
- Significant News or events,
- Change in Market sentiment
- Fundamental Factors like Dividend etc
- Technical Factors like Margin Call etc
Breakaway Gaps is a gap which indicates a movement of Price action where Stock tries to come out from congesation Zone ( which can be quite Long), Breakaway Gaps shoul be accompanied with huge volume and it begins a new Trend

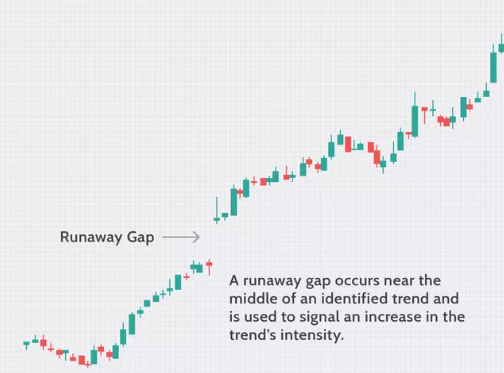
Runaway Gaps usually happens in the middle of original Trend it indicates that the Buyer who ealier missed the opportunity was sitting on sideline decided to join the runing Trend.
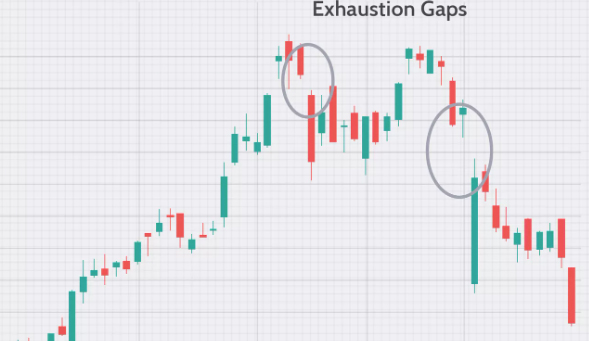
Ehaustion Gap occurs when a good uptrend or downtrend is about to end
Key featrures of this Kind of Gaps :-
- Huge difference between previous closing and Today opening Price,
- Huge volume intially
- After all this we find sudden fall in Price & Volume
