what is Price Action and its components

Price Action is the study of the movement in stock price and all the technical analysis are output of study of Price Action behaviour.To do this analysis we use Candlestick,Chart Pattern,Volume. Price Action | स्टॉक की कीमत में आने वाले परिवर्तन का अध्ययन है और सभी तकनीकी विश्लेषण प्राइस एक्शन व्यवहार के अध्ययन का परिणाम हैं। इस विश्लेषण को करने के लिए हम कैंडलस्टिक, चार्ट पैटर्न, वॉल्यूम का उपयोग करते हैं।
Indicator based Trading Vs Price Action based Trading,In initial days of his career Every Trader search for Best Indicators ( which never fails) then he try to customise his selected Indicator to find out best setting,sooner or later he realised this Indicator based working but only in tranding Market and whatever Signal he is getting quite delayed now question arises what is the solution Solution of all the above problem is Price Action It provides timely alert with good observation skill one can customise it upto great extent |
Indicator based ट्रेडिंग बनाम Price Action आधारित ट्रेडिंग, अपने करियर के शुरुआती दिनों में हर Traders सर्वश्रेष्ठ Indicators (जो कभी विफल नहीं होता) की खोज करता है, फिर वह सर्वोत्तम सेटिंग का पता लगाने के लिए अपने Indicators को सेट करने का प्रयास करता है, जल्द इस बात का एहसास होता है की इंडीकेटर्स केवल ट्रेंडिंग मार्केट काम करता है और सिंग्नल भी लेट मिलता है ,अब सवाल उठता है कि समाधान क्या है उपरोक्त सभी समस्या का समाधान Price Action Trading है,
What is Candlestick
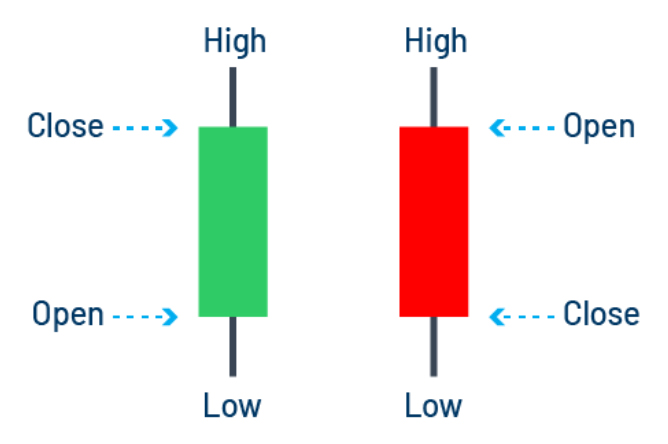
A Candle is a diagrammatic representation of Open, High, Low & Close of any stock in a given Time Frame. Concept of Candlestick was developed by Japanese Rice Traders.Let’s discuss the components of Candlesticks in details –
- Body #The Rectangular Section between High & Low is known as body of the Candle, if its colour is Green, it indicates Closer price is higher than previous Candle closing or vice-versa,Body is the essence of Candle it’s a body of Candle which help ultimately in finding out the category of the Candle, who is wining or loosing (Bull or Bear)
- Wick # Upper Shadow (part) or Lower Shadow (Part) of the Candle
- Open # Its an opening price of stock when session starts,
- High # It indicates highest price of the session if wick is not there it indicates Candle is closed at day’s High,
- Low # it just opposite to the High part of Candle,
- Close # In indicates the level where candle is closed during the session
- Time Frame # It can be drawn in any time frame (Minutes, hours, daily, weekly, Monthly)
- Japanese give great emphasis on opening or closing of the price, it’s a closing of price which defines who won the Race Bear or Bull
- First Candle of the Day with heavy volume & Last Candle of the Day with heavy volume should get special importance while taking intraday or overnight Trade

कैंडलस्टिक क्या है ?
एक कैंडलस्टिक एक निश्चित समय सीमा में किसी Stock के ओपन, हाई, लो और क्लोज दिखाता है। कैंडलस्टिक की अवधारणा जापानी चावल व्यापारियों द्वारा विकसित की गई थी। आइए कैंडलस्टिक्स के components पर विस्तार से चर्चा करें ):
बॉडी # HIGH और LOW के बीच के पार्ट को कैंडल की बॉडी के रूप में जाना जाता है, यदि इसका रंग हरा है, तो यह इंगित करता है कि क्लोजर कीमत पिछले कैंडल क्लोजिंग से अधिक है या इसके विपरीत, बॉडी कैंडल का सार है, यह कैंडल की बॉडी है जो अंततः मोमबत्ती की श्रेणी का पता लगाने में मदद करें, कौन जीत रहा है या हार रहा है (Bulls या Bears )
Wick # Candle की ऊपरी छाया (भाग) या निचली छाया (भाग)।
Open # यह sessio शुरू होने पर स्टॉक की शुरुआती कीमत है,
High # यह sessiom के उच्चतम मूल्य को इंगित करता है यदि बाती नहीं है तो यह इंगित करता है कि कैंडल दिन के उच्चतम स्तर पर बंद है,
Low # यह Candle के ऊंचे भाग के ठीक विपरीत है,
Close # इन उस स्तर को इंगित करता है जहां session के दौरान Candle बंद होती है
Time Period # इसे किसी भी समय सीमा में खींचा जा सकता है (मिनट, घंटे, दैनिक, साप्ताहिक, मासिक)
जापानी Trader Candle के खुलने या बंद होने पर बहुत जोर देते हैं, Candle का Closing price है जो परिभाषित करता है कि रेस बियर या बुल किसने जीता
इंट्राडे या ओवरनाइट ट्रेड लेते समय भारी वॉल्यूम वाली दिन की पहली कैंडल और भारी वॉल्यूम वाली दिन की आखिरी कैंडल को विशेष महत्व मिलना चाहिए।


