What is Rectangle Pattern
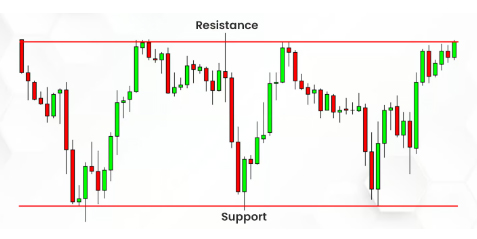
Rectangle pattern is one of the most easiest pattern to recognise, its a combination of Two line one upper Line and other one is Lower Line. Its a outcome of consolidation or Non trending Zone ( Refer Below given Image)
Rectangle pattern को काफी आसानी से चार्ट पैटर्न पर पहचाना जा सकता, यह २ लाइन का कॉम्बिनेशन होता है, Upper लाइन ( रेजिस्टेंस) और lower लाइन (सपोर्ट). यह पैटर्न एक कंसोलिडेशन और नॉन ट्रेंडिंग जोन का रिजल्ट होता है ( नीचे हुई इमेज को चेक करे)
I share my chart analysis on Front Page, click the Link for more Details
For Real Learning with Real Trades click this Link….
This Pattern can be further divided into Two Parts (इस पैटर्न को आगे दो भागों में विभाजित किया जा सकता है) :-
- Bullish Rectangle Pattern || बुलिश रेक्टेंगल पैटर्न
- Bearsih Rectangle Pattern || बेयरिश रेक्टेंगल पैटर्न
Lets discuss these pattern in details || आइये इस पैटर्न पर विस्तार से चर्चा करें
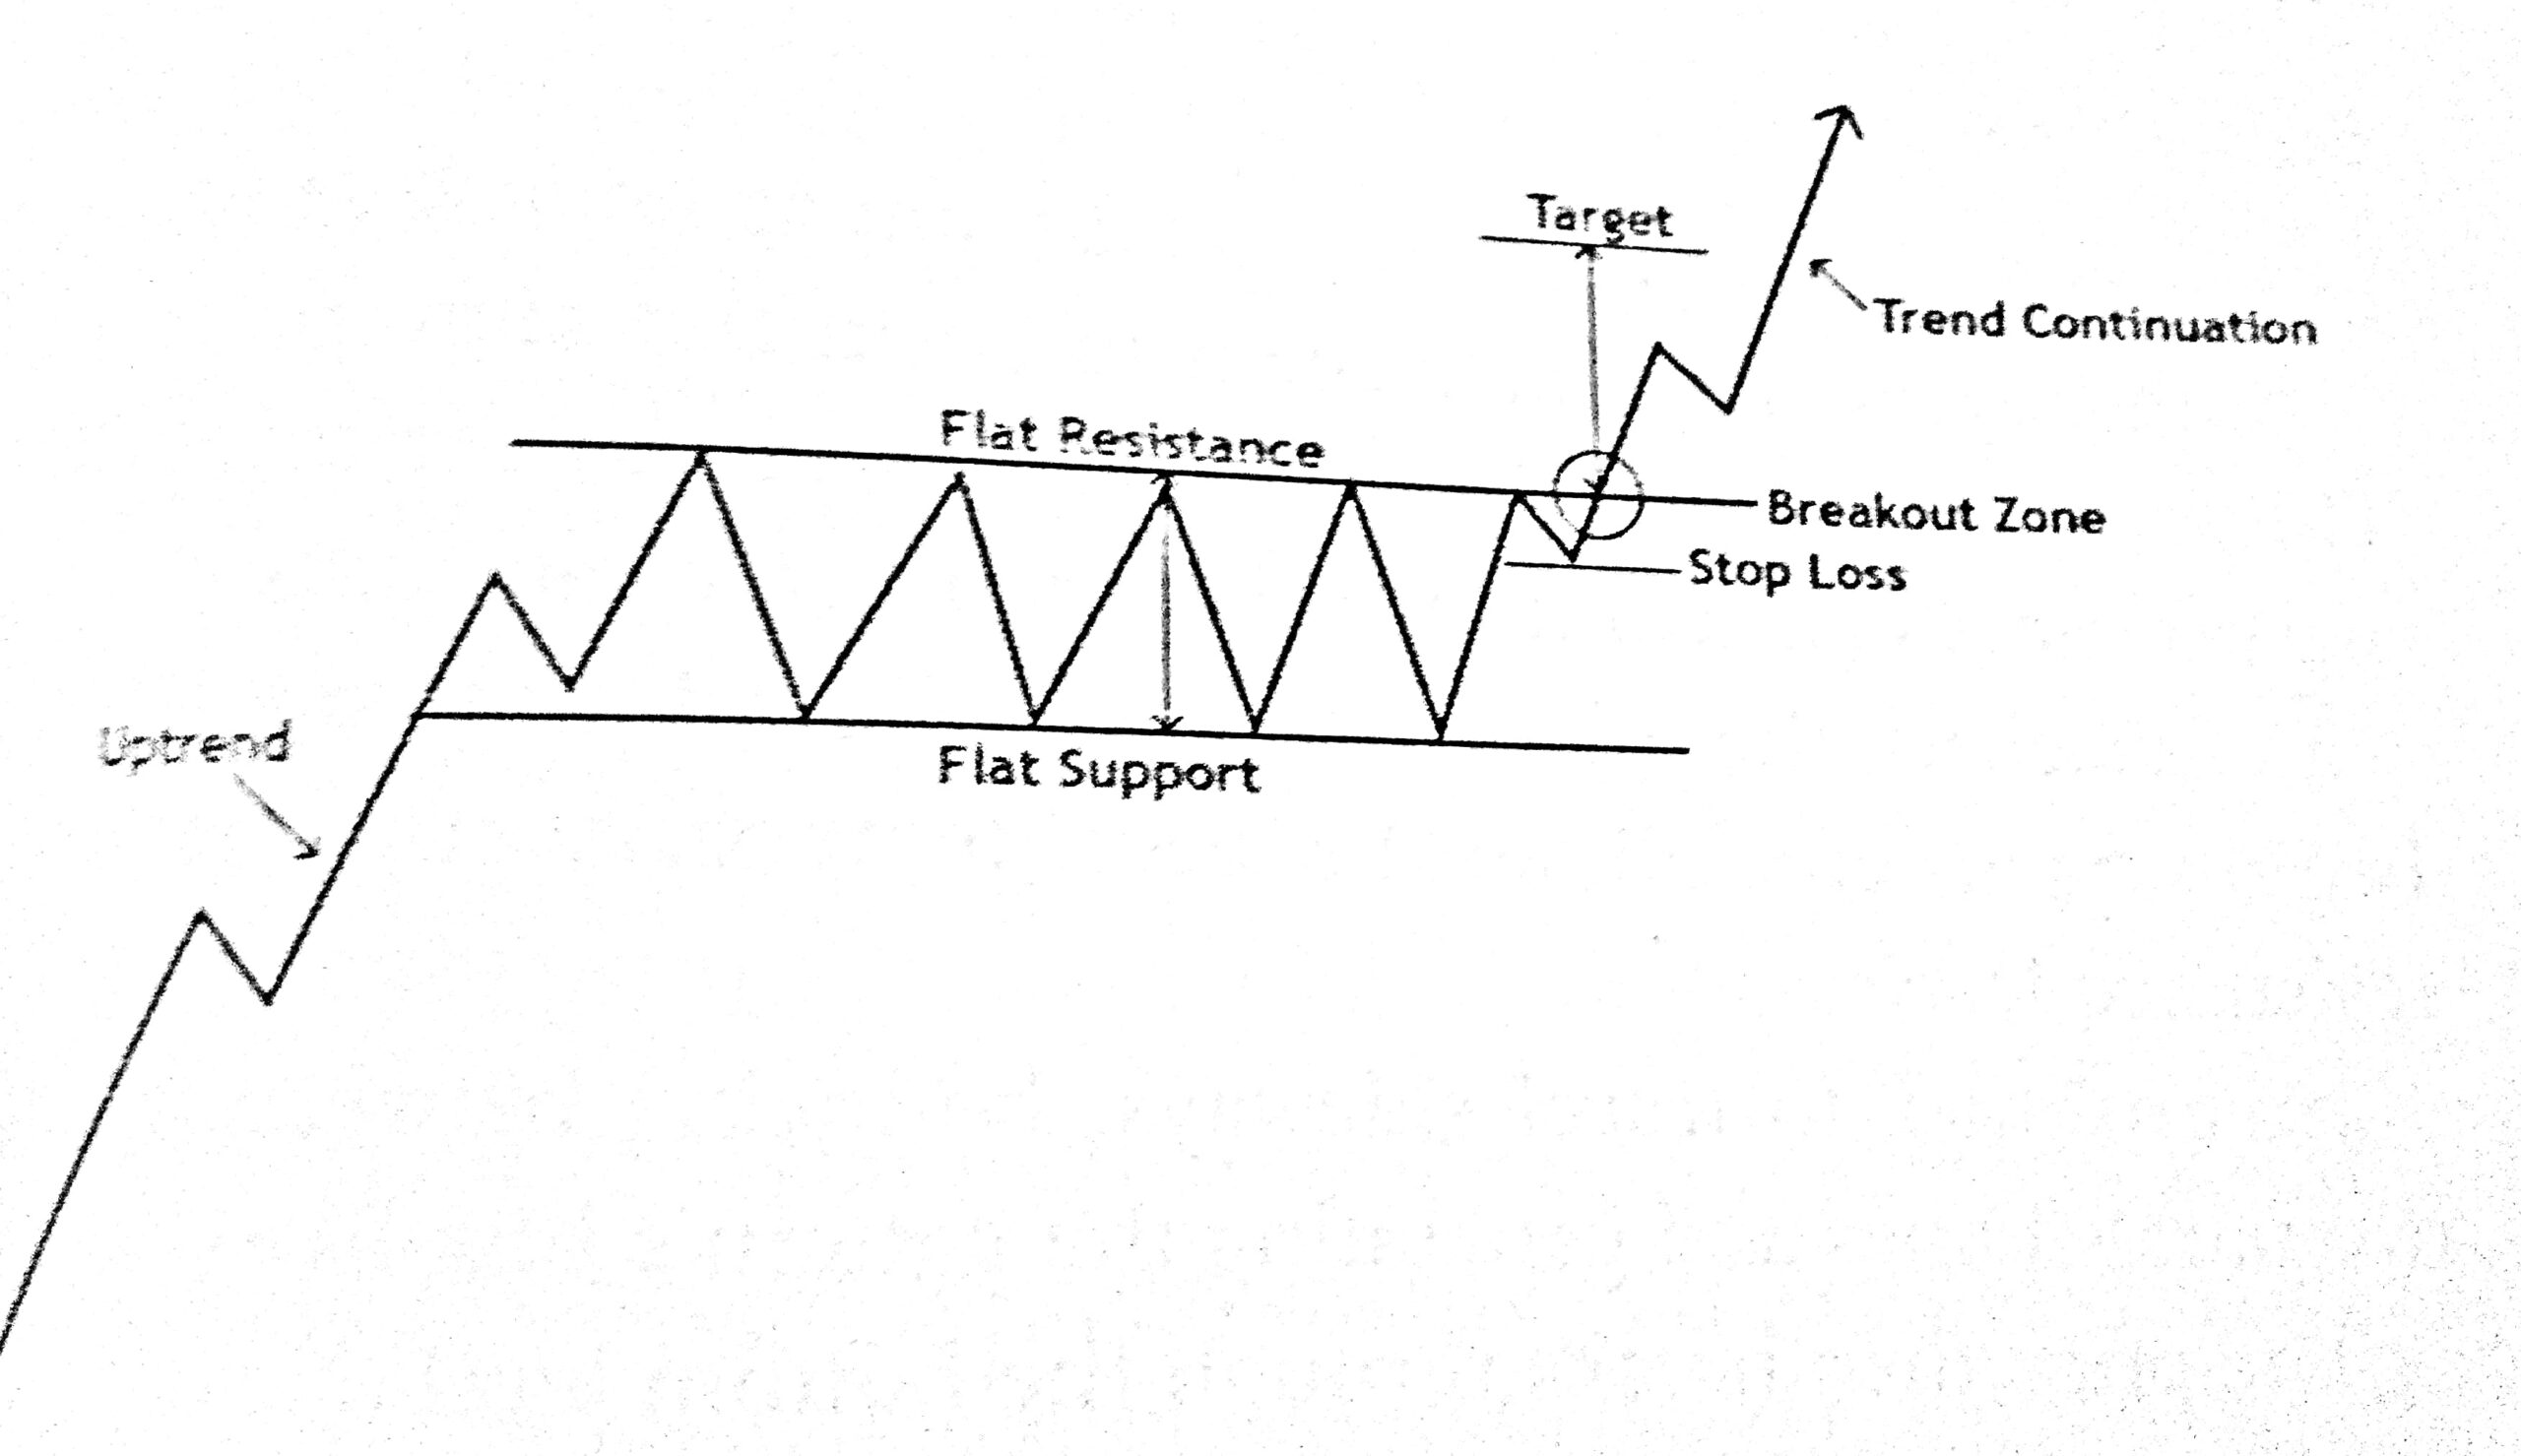
Bullish Rectangle Pattern is formed when stock which was trading in range and making almost perfect high and low break that range and shift to a different range towards upside (Refer image) || बुलिश रेक्टेंगल पैटर्न तब बनता है जब स्टॉक जो एक रेंज में कारोबार कर रहा था , जब उस रेंज को तोड़ता है और ऊपर की ओर एक अलग रेंज में ट्रेड मे ट्रेड करने लगता है (इमेज देखें)
Key fetaures of this Pattern || इस पैटर्न की मुख्य विशेषताएं :-
1) Overall Trend should be positive for the stock ( before the consolidation Zone) || बड़े timeframe मे स्टॉक का ट्रेंड positive ( तेजी ) का होना चाइये, कंसोलिडेशन से पहले
2) Entry should be above the Resistance Zone || प्रवेश Resitance zone से ऊपर होना चाहिए,
3) Stop Loss should be just blow the immediate Swing Low ( Support Line) || स्टॉप लॉस करीबी स्विंग लो के नीचे होने चाहिए
4) Taregt should be more then the height of Rectangle || टारगेट रेक्टेंगल की हाइट से ज्यादा होना चाहिए
5) Breakout should happen with a strong volume || ब्रेकआउट मजबूत वॉल्यूम के साथ होना चाहिए
Real Life Example ( will be updated soon)
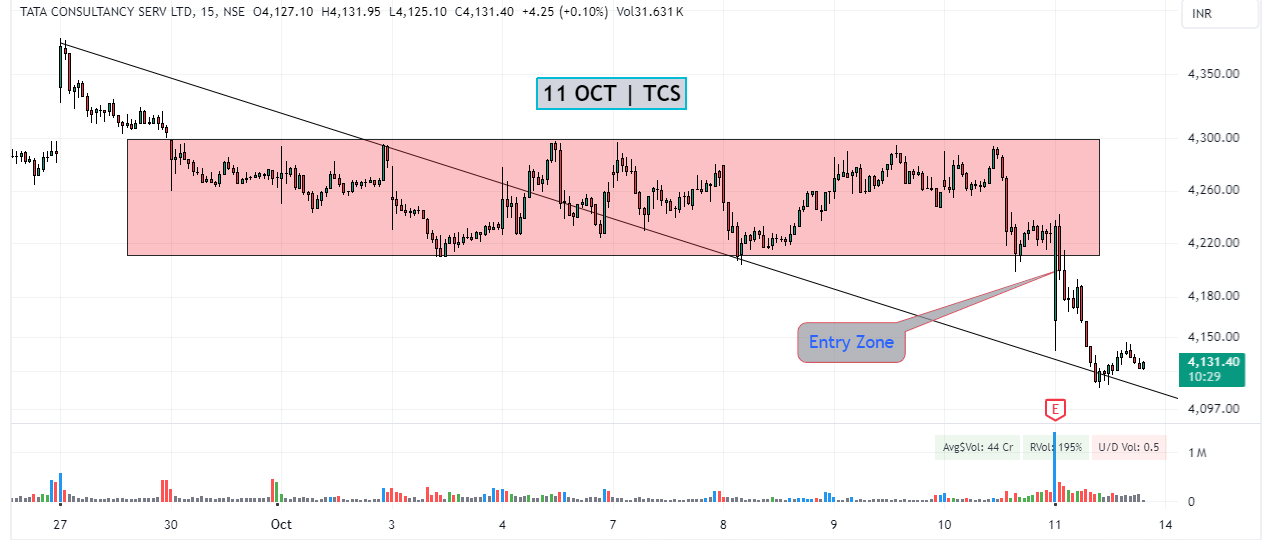
Bearish Rectangle Pattern is formed when stock which was trading in range and making almost perfect high and low break that range and shift to a different range towards upside (Refer image) || बेयरिश रेक्टेंगल पैटर्न तब बनता है जब स्टॉक जो एक रेंज में कारोबार कर रहा था , जब उस रेंज को तोड़ता है और नीचे की ओर एक अलग रेंज में ट्रेड मे ट्रेड करने लगता है (इमेज देखें)
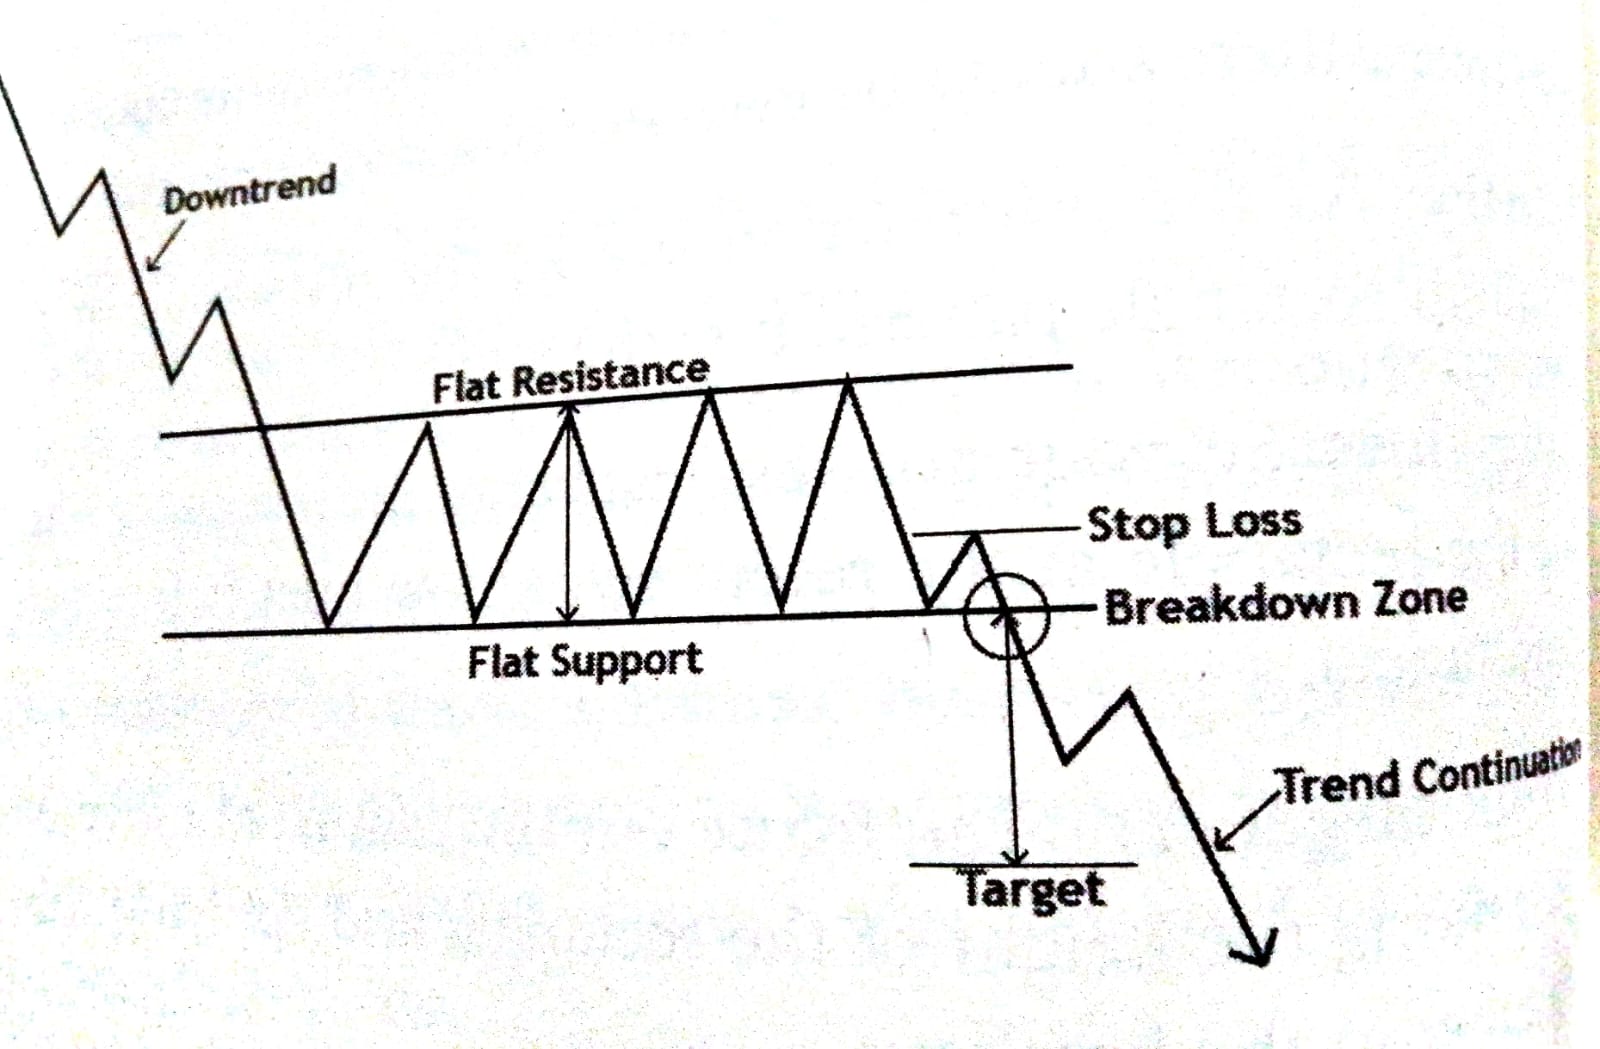
Key fetaures of this Pattern || इस पैटर्न की मुख्य विशेषताएं :- :-
1) Overall Trend should be Negative for the stock ( before the consolidation Zone) || बड़े timeframe मे स्टॉक का ट्रेंड नेगेटिव ( मंदी ) का होना चाहिए , कंसोलिडेशन से पहले
2) Entry should be below the Support Zone || प्रवेश Support zone के नीचे होना चाहिए,
3) Stop Loss should be just above the immediate Swing High ( Resistance Line) || स्टॉप लॉस करीबी स्विंग हाई के ऊपर होने चाहिए
4) Taregt should be more then the height of Rectangle || टारगेट रेक्टेंगल की हाइट से ज्यादा होना चाहिए
5) Breakdown should happen with a strong volume || ब्रेकआउट मजबूत वॉल्यूम के साथ होना चाहिए
Real Life Example :-
