How to learn Trading | Where I can learn Stock market
The Indian share market presents many opportunities for investors & Traders but real problem is to find a plateform where Trading learning is possible with Real Trades
I have created this website with a view where New Trader can learn Trades with the
Basics of Equity,Derivative & Technical Analysis
- What is Stock Market,Important Indian & Global Indian Indicies ?
- What are the Important Books, websites & Mobile App for Stock Market ?
- What is Trading & Demat Account ?
- What are the types of orders ?
- What is Contract Note & its specifications ?
- What are the different Trading Formats & rules related to them ?
- What is Market Capitalisation & related concepts ?
- What are the Key events & corporate actions that affect stock Prices ?
- What is INDEX & how investment,Trading & Hedging can be done in Index ?
- What is Derivative Market and its Significance ?
- What is Hedging and How Derivative Technique can be useful ?
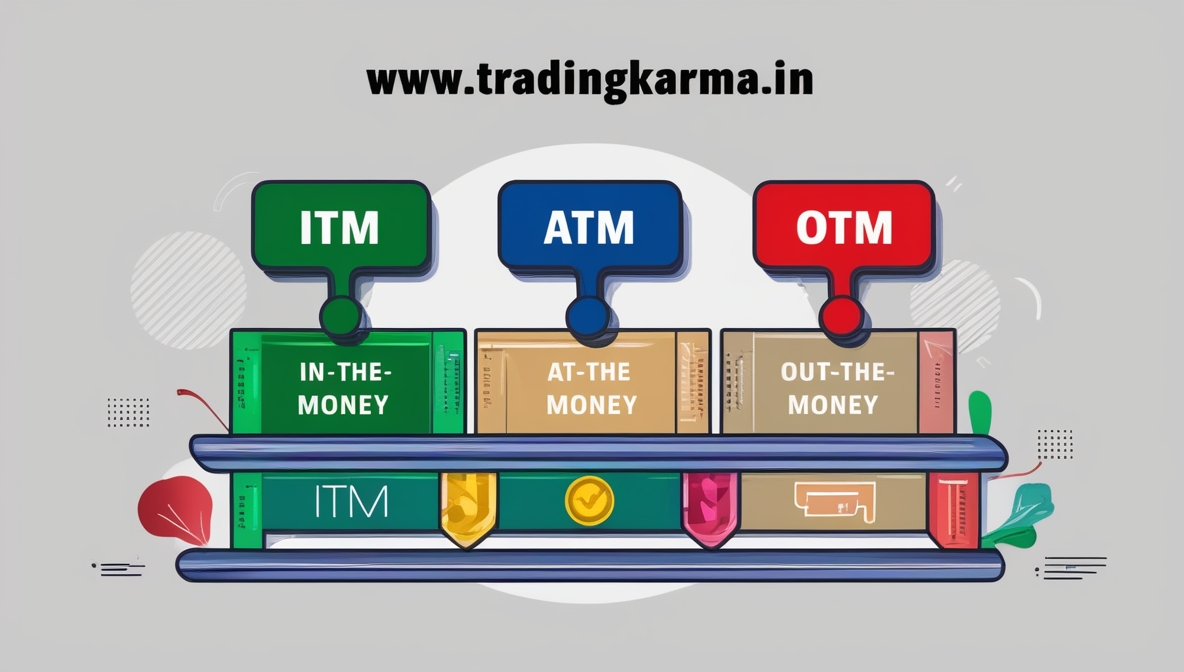
- What is Option Chain & its Important contents (ITM,ATM,OTM etc)
- How Option Prices are calculated & Importance of Option Greeks ?
- What do you mean by Option Strategy ?
- What is Price Action and its major components ?
- What is candlestick ?
- What are the Important Candles & Candlestic Pattern ?
- How to find Trend with the help of Chart Reading ?
- What are the Different type of Chart Patterns ?
- What is the Tax structure for Trading & invsting activities ?
- What is minimum Capital required to Trade ( as per my Model) ?
Question # 1
What is Stock Market & Important Concepts related to it ?
- Stock Market is a place where company comes for raising funds, same shares are available in exchanges for Trading, this trading can be for few minutes, day, weeks or months.
- Indian stock market is the fastest growing market with lowest market participation, lack of training opportunities, mis information are the main reason for lower participation ratio.
- List of Major Participents in Indian Stock Market (Rules for all this Market participents are set by SEBI and even in some cases by the exchange also):-
- Private Promotors / Founder of the Company
- Govt of India – Coal India, BPCL, HPCL
- FII- Foreign Institutional Investors.
- DII- Domestic Institutional Investors.
- HNI- High Net-worth Individuals.
- Professional Traders.
- Retail Traders
- Important Exchanges of India are NSE, BSE & MCX
Time Slots available for Trading :-
- Pre-Market Sessions: – First 15 Minutes of Market (9.00 to 9.15), these sessions created to avoid unnecessary volatility in Market. In First 8 Minutes orders are collected, modified or cancelled by the Exchanges. This session helps in setting the tone of the market(stock/Index) for rest of the Trading Session. Only Equity Trades are allowed in this session, nothing to do with Derivative Market
- Post Market Session: –Post Market sessions start at 3.40 and close at 4.00, Order only for Equity can be placed just like morning Sessions. Market Depth is very low in this segment and only Cash and Carry order can be placed
- Commodity Market:-Morning Session starts from 9 am to 5 PM and the evening sessions starts at 5 in the evening and continues between 11.30 to 11.55 in the evening
- List of Important Global Indicies :-
Role of Depository
A depository refers to a space where an asset is held for storage and safety. An example of a depository may be a bank, financial institution, or organization aiming to hold assets in dematerialized form. They interact with their clients through DPs (Depository Participants), also called stockbrokers. A depository provides security and liquidity to the held assets and ensures smooth transactions for the investors.
- Benefits of Depository: –
- No risk of Theft
- Time Saving
- Increased Efficiency
- Secure & Convince
Question # 2
What are the Important Books,websites,Mobile App for Stock Market ?
If you are seriously interested about stock market learning importance of Reading good Books & access to useful sites & Mobile app cannot be ignored. surprisingly most of these stock market learning resources are available for free on internet (or at very reasonable prices). I tried to summarise them, please check the list
Recommended Books for Stock market: –
Technical Analysis of the Financial Market,
Super Trader,
Atomic Habits,
The Disciplined Trader,
Unknown Market Wizards,
Trading in the Zone,
Option Volatility & Pricing,
Japanese Candlestick
NISM 8 & 15 Study Module
Useful website & Mobile App for trading in stock market: –
Money control,
Optra or Sensibull,
chartink,
NSE India,
screener,
Trading view,
stock edge,
Market pulse,
Dhan trading app
Quora
screener.in and www.tradingkarma.in
Question-3
What is Trading & Demat Account ?
To trade in Indian stock market having Trading & Demat Account is minimum requirement now question arises “What is Trading & Demat Account”
Trading Account is basically use for executing buy & Sell order, if you are trader and mainly dealing in intraday trade or doing trading in Derivatives or (F&O), you will use trading Account only. Trading accounts are interlinked with your Bank Account & Demat Account.
Demat Account primarily use for holding & sorting securities in electronics (paper shares are history now), it ensure safety of your holdings, not only for shares in case of mutual funds or Government securities also you need Demat Account.
Important Documents required to open Trading & Demat Accounts: –
PAN Card,
Residence Proof (Adhar Card),
ID Proof,
Passport Size Photo
Most Common Type of Orders :
Question-4
What is Contract Note & its specifications ?
Click this link to know what is Contract Note with real example
Question-5
What are the different Trading Formats & rules related to them ?
- SCALPING is a trading style that specializes in capturing small profit, it requires fast execution skills, strong exit plan, minimum transaction cost. This Trade can be for few Seconds or a minute
- INTRADAY TRADING Is Buying & selling a Stock same day with Pre-decided Target and defined stop Loss. Always Prefer to Trade in highly liquid stock {in good quality stock you can get margin up to 5X}
- SWING TRADING involves taking position in a financial instrument for more than day (and less than a month), Target & Risk can be predefined with the help of option strategy
- Positional Trading refers to a Trading style where one Take position in a good fundamentally strong stock. This position can be for few weeks or few months depending upon market cycle etc but while making such Trades one should be ready for measures like averaging & call writing etc.
one of the most common & in demand form of trading is Intraday trading, if you are taking position in any stock with a defined target & SL broadly, we can call it intraday trading.Let’s discuss in details rules & right timeframe required for intraday trading: –
- your Stop Loss & target should be clearly defined,
- Your stop Loss should not be more than 1 % of capital,
- Always prefer to trade in highly liquid stocks where entry & exit should be very easy,
- Prepare a watchlist of 3 to 5 stocks, for human brain tracking too much stocks in live market are not possible,
- Prefer to do one trade in a day or maximum 2 trades in a day,
- overtrading & revenge trading should be avoided,
- Time frame # 15 minutes & 5 minutes are the most preferred one,
- impact of trade should be same on your capital,
- Avoid any trading in first 15 minute,
- Always remember Trading is not about strategy infect its more of game of psychology
For Swing & Positional Trader Margin Trading Funding can be quite helpful feature, Lets understand it
When you use certain amount of yours and raise remaining part from Broker this facility of Fund arrangement is known as MTFand Broker charge interest on the sanctioned amount (interest rate is usually between 9 to 15 %) it all depends upon your Broker and the Plan you are having.Last but not least never forget leverage is a double edge sword if you don’t how to use it then it’s very dangerous and you can’t expect same amount of MTF on different stocks, it keeps on changing as you change the category of Stock
you can click this link to find out available MTF on different stocks
Question-6
What is Market Capitalisation & related concepts ?
- Total Market Capital # Numbers of Share available to Trade X Market Price of the Stock
- Free Flot Capital # Number of shares available to Trade (doesn’t include Promotor Share)
Free Flot Capital, further can be divided into :-
- Large Cap # Above then 20,000 Crore
- MID CAP # Between 5,000 to 20,000 Crore
- SMALL CAP # Up to 5,000 Crore
- Micro Cap # Less than 100 Crore
Lets discuss biggest company of India or NIFTY Top 10 Company :-
As we Know Nifty is Group of Top 50 Company of India these company selected or shortlisted on the basis of Some criteria like Floating Capital etc but surprising fact is only 10 Company the Bigger one Carry more than 50 % weightage in the Nifty Now the question arises Do you know the Name of Top 10 company and where you can find the updated List of these companies?
As I do active trading in NIFTY top 10 stocks on a positional basis (made 100 % return in last 18 months) quite actively as these stocks are institutional favourite provide better Price action based opportunity and i also get good Margin Trading facility in these Stocks.
You can also check the list of these stocks on NSE Site and get the discussed benefits.
Question-7
What are the Key events & Corporate Action that affects Stock Prices ?
Key Events refers to the act of Goverment or Regulator which are beyond the control of Market Participents but affects stock Prices in a bigger way. Some of them are :-
- Monetary Policy by RBI,
- Budgetary Policy or Budget,
- Elections,
- Fed Meeting & Policy related decisions,
- Corporate Earning Announcements,
- Indian Industrial Production (IIP) Data,
- Inflation data
Other then above mentioned Key events there are some Corporate (or Internal actions) also which affects share Price. Lets dicuss them in details :-
A)Dividend (Positive)# it’s a part of profit which divided among shareholders, It’s up to company Management to decide whether they want to distribute profit among shareholders or wants to reinvest the same in business progress or future activities. Some of the Dividend paying company are ITC, TCS, Infosys, IOC
B) Stock Split (Positive)# it’s a managerial decision which convert stock into small Ticket size only reason behind this stock is to increase the liquidity & Trading volume. Let’s take an example of MRF
C) Bonus Issues (Positive) # Bonus issue is the Reward given by the company out of the reserve to the Shareholders usually its given in the Ratio
Real life Example :-
D) Right issues (Positive)# Right issue is the way to raise Capital instead of Going to Public, company approach to the existing Shareholders
Real life Example: –
E) Buyback(Positive): – Buy back is an exercise where Company buys shares from the existing Shareholders, it works as an incentive for the Shareholders and helps in preventing company from take over
Real Life Example: –
F) Promotor Stake Sale(Negative) # Its quite possible Promoter of Listed company would like to sell his stake (or position) in the company, reason could be anything (known or unknown). Market doesnt take this news very positively most of the Time
Real Life Example: –
G) Bulk Deal/Block Deal (moderate to Negative)# If more then 0.5 % of equities (in any listed company) are exchanged between two parties, typically through a negotiated deal (not using open Market operations) is considered as Block/Bulk Deal
Click this Link to for NSE Bulk/Block data least Page
H) FPO (Follow on Public Offer (Positive) # When already listed company offers new shares to the existing shareholders. Company usually brings this scheme either :-
- To reduce its debt
- To increase its Capital Base
- Real Life Example: –
I) OFS (Offer for Sale) (usually Negative) # Under FPO listed company offers to the general public but its different from Regular IPO route and company is supposed to meet some Conditions
K) IPO (Initial Public Offer) # when a Non listed entity decided to get listed into stock market, reasons for fund raising could be :-
- Reducing Debt
- Raising Capital for upcoming project
- To know more about Latest IPO update click this link
- Real Life example
L) Insider Trading # Though Insider Trading is not a legal practice but its so common even in big corporates. Lets understand Insider Trading with realtime example
When a key person like Promotor,senior management creates position or help someone to create position is broadally covered under the Category of Insider Trading
Decison taken by Exchanges which affects share Price :-
Upper Circuit & Lower Circuit
- Maximum a Stock or Index can reach in any particular day is known as upper Limit
- Minimum a stock or Index can reach in any particular day is known as Lower Limit
- This Limit is created by exchange in Market to avoid any undue volatility and to protect the interest of small market player
- Exchange on a regular basis update the list of these stocks and limit is decided on the basis of stock category, F&O (or NON-F&O) etc
Question-8
What is INDEX & how investment,Trading & Hedging can be done in Index ?
- Index of any Country defines the strength of a Economy,
- In India we have two popular Index (Sensex/NIFTY),
- Sensex is the older one NIFTY introduced later on,
- Sensex is group of 30 Stocks & NIFTY represents 50 Stocks,
- Both Index represents almost all the sectors of economy,
=====
- Index investing is one of the safest form of Investing and most of the time it has seen INDEX ETF investing beat Mutual fund Performance ( we will study this concept later on in details)
- Trading in Index weekly or monthly expiry is also one of the possibility provided you have system to Trade and you know the importance of RISK & REWARD concept
- Index can also be used as hedging (its like buying insurance) tool for your position in ETF or individual stock
- For making a perfect hedging strategy knowing the concept of BETA is very important,
- BETA measures the change in stock Price or expected move in stock
- BETA more then 1 = stock is highly volatile
- BETA Less then 1= Stock is Less volatile
- Check your Stock or Portfolio BETA value here
Investment in Index or Concepts of ETF
- ETF is a collection of Investement such as Equity/Bonds,
- It provides you the benefits of both diversification of Mutual Funds & ease of Equity(easy buy/Sell)
- Low operational Cost
- Possibility of Customisation
- ETF available almost for all asset class (Index,Commodity,Fixed income,Foreign market) List is end less
- Check this NSE Site Link to know more about ETF and other related details
Question-9
What is the Tax structure for Trading & invsting activities ?
Question-10
What is Derivative Market and its Significance ?
Derrivatives (future or Option) are financial contract that derive their value from underline,
One can make good money by predicting the next move in underline,
Major Participants of Derrivative Market :-Derivatives plays a critical role in risk management, they can be used to protect against various types of risks such as interest rate, currency risk & commodity risk.
Hedger,
Speculator
Margin Trader,
Arbritrageurs
F&O market is important & but trading “only” in F&O is not so important, a right mix between Equity and Derivative what we needed
F&O gives an opportunity for hedging & leverage,
Brings lot of Liquidity,
If you know how to handle position sizing, risk management, Risk & Reward ratio F&O Trading provides great opportunity.
Different Contracts available for Trading :-
भारतीय बाज़ारो मे mainly 4 तरह के Derivative Contract Trade होते है :-
Forward Contract
Future Contract
Options Contract
Swap Contract
हम Future & Option के Concepts को detail मे समझते है
Future Contract 2 party के बीच का agreement है जिसमे वो तय करते एक निश्चित तारिख को एक निश्चित दाम पर वो उस सौदे का भुगतान करेंगे Future कॉन्ट्रेक्ट से जुड़े सरे नियम जैसे Expiry date, Lot साइज़ , Margin आदि Exchange तय करता है
If you are having bullish view you will long future & if you are having bearish view you will short Future
Options contracts are different from future contracts, these contract can be further divided into two parts, Call and Put. We will discuss them in details from Buyer & Seller point of view
Option Buyer point of view :-
- Call # if you are expecting rise in stock price one can buy call
- Put # If you are expecting fall in stock price one can buy PUT
Option Seller point of view :-
- Call # if you are expecting fall in stock price one can sell call
- Put # If you are expecting rise in stock price one can sell PUT
Role of Margin in Derivative Contract
In Derivative trading Margin refers to the minimum amount required to maintain in account which allows Traders or Investors to take position in a particular stocks with borrowed Funds.
Key features :-
- It allows Traders to take position without investing the entire value in a particular Trade
- In case if open position start going against the Trader he is required to deposit the short funds or Broker can liquidate his position (to protect his capital)
Concept of Expiry & Lot Size in Derivative Market
If you are trading un the Derivative Market (Future & Option) the expiry date refers to the last date of the contract after which the contract would not hold valid
- Monthly Expiry held on last Thursday of evey month
- As expiry comes closer volatility increases and option prices react in a quite unique (or wild) way
Lot size(or qty) refers to the minimum quantity of shares that one is allowed to buy or sell as per the terms of contract.
- These qty is decided by the Regulators(Exchange or SEBI),
- Usually value of lot size is between 5 Lakh to 10 Lakh,
- For example few months back Lot size of NIFTY was 50 and now it reduced to 25
Question-11
What is Hedging and how Derivative techniques can be used helpful ?
Hedging implies taking opposite position in a particular stock (or index ETF) which helps you offset your loss in a investment.
- It helps in reducing Loss and increase profit if it uses effectively
- It works like insurance and provide protection against short term uncertainity and helps Traders or investors to focus on their original positional
- Understanding the concept & importance of Beta also helps in creating hedging strategy
- Click this link for better understanding of NIFTY ETF & Hedging
Question-12
What is Option Chain and its important content (ITM,ATM & OTM)
Option Chain can be described as detailed information of all option contract in that particular Expiry. Now question arise how Option cahin looks and what are the important contents of Option Chain, I will try to solve this puzzle with the help of Real Option Chain taken from NSE Website
Lets understand this concept with the help of Real example, Today is Sept-1 and NIFTY Closed at 25235
All coloured portion is ITM & Non coloured is OTM
Question-13
How Option Prices are calculated (Option greeks + IV + VIX ) ?
Option Price of any instrument mainly affected by :-
- Intrensic value and Time value,
- Option prices are also affected by volatiliy & Demand or supply factor
- Last but not least Option Greeks, IV & VIX
- Click this Link for details on Intrensic & Time Value
- Click this link for detail on Major Option Greeks (Delta, Theta Gamma, Vega ), IV and VIX
Question-14
What do you mean by Option Strategy ?
Will be updated soon….
Difference type of Directional and Non Directional Optional Startegy
Developing Option Strategy with the help of Sensibul/Opstra ?
Question-15
What is Price Action and its major components ?
- In Stock Market BHAV(Price) hi BHAGVAN(Supreme) hai,
- Price Action is study of Price Behaviour,
- To do this analysis we use Candlestick,Chart Pattern,Volume,
- All Indiacators are byproduct of Price Action
- To get better result in Price Action Trading setting a blending of different Timeframe,Index comparison etc matters
Indicator based Trading Vs Price Action based Trading
- In initial days of his career Every Trader search for Best Indicators ( which never fails),
- Then he try to customise his selected Indicator to find out best setting,
- sooner or later he realised this Indicator based workin but only in tranding Market and whatever Signal he is getting quite delayed
- Now question arises what is the solution,
- Solution of all the above problem is Price Action,
- It provides timely alert
- with good observation skill, one can customise it upto great extent
Question-16
What is candlestick
Lets understand Components of Candles in detail
- Under Japanesse Candlestick study a great ephasis is given over the Study of Opening and Closing of any Candle
- Timeframe can be any (15 min,hourly,daily, weekly)
- In this section we are going to study Opening Price Level of any Candle in details with the help of Realtime example
- All Trades are taken from 09 Aug 2024
- Open = High Trades taken from NIFTY 50 and Open = Low are from F&O Section (as no Open = Low Trades found in NIFTY 50 stocks
- Open = High conveys Stock will correct( or Fall), Keep a Stop Loss of Day high and your Risk Reward Ratio should be 1 : 1.5 or More
- Open = Low conveys stock will rise ( or Increase), Keep a Stop Loss of Day Low and your your Risk Reward Ratio should be 1 : 1.5 or More
Example of Open=High
Indusind
Maruti
Bajajfinserve
Example of Open= Low
SRF
Indian Hotel
Balrampur Chini Mill
Significance of Close = Low
Tata Steel Short Trade
Significance of Close = High
Tata Steel Long Trade
ABFRL 16 Aug Chart
Question-17
What are Important Candles & Candlestic Pattern?
Bearish Engulfing
Bullish Engulfing
Real time Trade
What is Dozi Candle (or Spinning Top) ?
Dozi Candlestick
Spinning Top
Spinning Top is just like Dozi indicates the indecision of Buyer & Seller only difference is unlike Dozi Candle it has very Small Body. Taking real time Trades to indicate the importance of this concept (14 Aug Bharti Airtel Chart & 16 Aug HDFC Life Chart)
16 Aug / ACC Chart where Bearish Engulfing failed, Spining Top & Strong Candle Close = high delivered
Tweezer Top or Tweezer Bottom
Twezzer Bottom
Twezzer Top
Hammer (or Inverted Hammer ) ?
Marubozu Candle
Morning Star / evening Star / Shooting Star
Morning Star
Evening Star
Shooting Star
Bearish Harami (or Bullish Harami) ?
Bullish Harami will be uploade soon
Hanging Man
What is abandoned Baby (Top or Bottom) ?
Question-18
How to find Trend with the help of Chart Reading ?
Charts (or Chart Pattern) is a combination of different changes in a price of a security over a given period, It allows the Trader to take leveraged position ny predicting future price movement on the basis of existing(or Past) Price Action
Chart Pattern can be divided into 2 Parts :-
Continuation Chart Pattern & Reversal Pattern
Lets discuss them in a detail
Continuation Pattern happens in the middle of original Trend, after taking a pause Index or stock start moving in the original Direction. Refer below given image( we will discuss all possible types of continuation pattern in Next question)
Lets discuss second category of Chart pattern,Reversal Pattern it implies change in Trend. In short Bear or Bull loosing their grip and original Trend is in danger now Trader with existing position will close their position and will prefer to take contra(or opposite) Psoition. Refer below given SBI Chart
Price Action movemement can be categorised into 2 Parts :-
Trending (Uptrend/Downtrend) and Sideway(Ranging)
Lets them discuss in details
Uptrend/Downtrend # If security is closes either higher or lower (in any given Period) is said to be Trending, Positive move is categorised as UPTREND & Negative Move is categorised as DOWNTREND
Sideway/Ranging # If Security is stuck in range between high & low (Resistance / Support ) this kind of Price Action broadly known as Sideway/Ranging Market, these consolidation in Price Action finally results into Trending Move
Breakout is Potential Trading opportunity on the Long side it occurs when Price climbs above the Resistance Level on the other hand if Price starts trading below the support level its a shorting opportunity and broadly known as Breakdown
Conditions for Genuine Breakout/Breakdown
- Strong volume,
- Significant Support/ Resistance,
- Breakout in Line with Long Term Trends,
- Low volume before breakout is a good sign,
- consolidation or sideway price action also plays an important role
ICICI Bank (75 Min Chart) between 12 Aug to 30 Aug
After consolidation stock after making Lower Low stock made a high ( Breakout), Entered on 12 Aug ( after breakout confirmation) confirmed almost all the above given conditions
SBI (75 Min Chart) between 02 Sept to 06 Sept
Lets discuss Support & Resistance in detail
- Support is a level where Stock take a rest(stop) for a while from there it takes a reversal
- If support is broken due to any reason stock try to find new supporting level at much lower point
- In reversal form of Trading, Trader Prefer to take a position at lower level and prefer to sell at resistance Zone
- If support is Broken and Stock start making Lower Low position this will be the time to take short position in the stocks ( Refer below given chart)
- Resistance is just opposite to the Support and its belived that selling pressure will come around this level
- If Resistance is broken due to any reason stock try to find new Resistance level at much higher point
- In reversal form of Trading, Trader Prefer to take a position at higher level and prefer to buy at support Zone
- If Resistance is Broken and Stock start making Higher High position this will be the time to take Long position in the stocks ( Refer below given chart)
After going through all the above discussion now we know that Trader main concern is to find Trend of the Stock and No doubt Trend is the real Friend of any Trader.
Gaps also plays an important role in enhancing (on analysis) of the Trend
Gap up in the stock or Index shows that People are impatient to buy and on the other hand Gap down in the Stock or Index shows that the People are impatient to sell
Lets discuss the Type of Gaps in detail :-
- Common Gap
- Breakaway Gap
- Runaway Gap
- Ehaustion Gap
Common Gaps are the outcome of routine Trading Activity usually these gaps occurs close fast
Major Reaons for these kind of Gaps :-
- Significant News or events,
- Change in Market sentiment
- Fundamental Factors like Dividend etc
- Technical Factors like Margin Call etc
Breakaway Gaps is a gap which indicates a movement of Price action where Stock tries to come out from congesation Zone ( which can be quite Long), Breakaway Gaps shoul be accompanied with huge volume and it begins a new Trend
Runaway Gaps usually happens in the middle of original Trend it indicates that the Buyer who ealier missed the opportunity was sitting on sideline decided to join the runing Trend.
Ehaustion Gap occurs when a good uptrend or downtrend is about to end
Key featrures of this Kind of Gaps :-
- Huge difference between previous closing and Today opening Price,
- Huge volume intially
- After all this we find sudden fall in Price & Volume
Question-19
What are different types of Chart Pattern ?
Cahrts are the combinations of different candles, candlestick pattern, timeframe, it helps Traders in finding right direction and these Chart patterns works in all asset class (Gold,silver,Bond,stock etc)
Chart Pattern can be further divided into Two Parts :-
- Continutinuation,
- Reversal