An index is a measurement of the performance of a group of stocks that represent a particular market or sector, for example NIFTY covers 50 stcoks which represents different Sectors
Key Features of Indexes :-
-
Benchmarking: Investors and analysts use indexes to gauge market performance.
-
Diversification: An index represents multiple stocks, reducing the impact of individual stock volatility.
-
Investment Tool: Index funds and ETFs allow investors to invest in a whole index rather than individual stocks.
Popular Indexes :-
MSCI World Index – Tracks global equity markets.
S&P Global 100 – Covers the top multinational companies.
S&P 500 – Tracks 500 large-cap U.S. companies.
Dow Jones Industrial Average (DJIA) – Includes 30 major U.S. companies.
NASDAQ Composite – Focuses on tech-heavy stocks.
FTSE 100 – Includes 100 large-cap UK companies.
Nikkei 225 – The main index for the Tokyo Stock Exchange.
Nifty 50 – Represents the top 50 companies on the NSE.
Sensex (BSE 30) – Comprises 30 well-established companies on the BSE.
My view on NIFTY and Details of Previous Trades :-
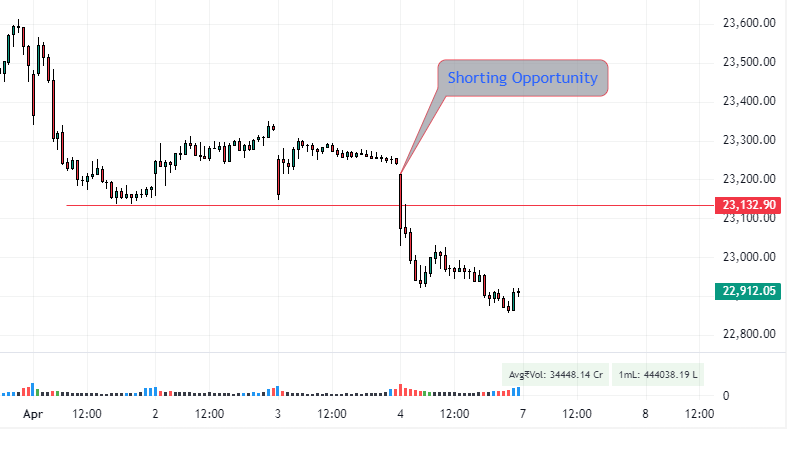
This week (Apr-4 to Apr-10) NIFTY and Global Market will react to Tariff Decision. I am having Bullish Bias as per Thursday Closing Chart, I will change my view only if NIFTY starts trading below 23132 and prefer to take short position against my holding, till then no Position
Click the under given Link for previous week NIFTY weekly Expiry Trades created for hedging purposes
For 9 Jan Expiry Trade details Click this Link
For 16 Jan Expiry Trade details Click this Link
For 23 Jan Expiry Trade details Click this Link
For 30 Jan Expiry Trade details Click this Link
For 06 Feb Expiry Trade details Click this Link
For 13 Feb Expiry Trade details Click this Link
For 20 Feb Expiry Trade details Click this Link
For 27 Feb Expiry Trade details Click this Link
For 06 Mar Expiry Trade details Click this Link
For 13 Mar Expiry Trade Details Click this Link
For 20 Mar Expiry Trade Details Click this Link
For 27 Mar Expiry Trade Details Click this Link
For 03 Apr Expiry Trade Details Click this Link
Please check the under given chart and other detail for my short Trade in NIFTY …..
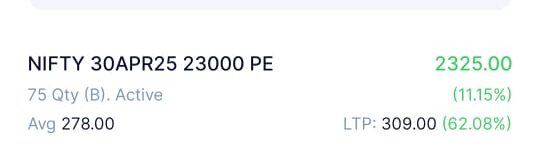
Day-01 # Today NIFTY (around 10.00), bought 23000 PE (30 April Expiry) @ 278 || on Closing Basis I am having Profit of 2325 Per Lot …..
Day-02 # Today NIFTY opened gap down(@21808), around 3.15 I squared off my position || On closing basis I booked profit around 57,208 apx….