what is Ascending | Descending Triangle Chart Pattern
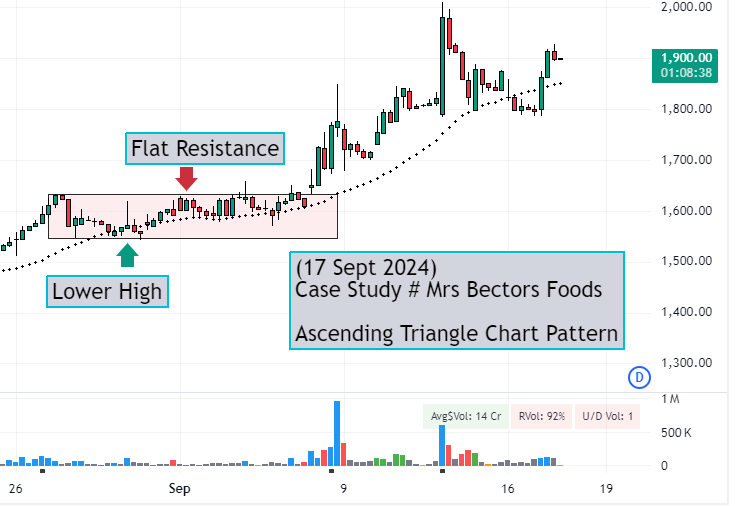
Ascending Triangle Chart Pattern is a Bullish form of chart pattern, in which we see a rising upward line (or support) | Ascending Triangle एक तेजी का चार्ट पैटर्न है, यह २ लाइन का कॉम्बिनेशन है सपोर्ट लाइन और रेजिस्टेंस लाइन, जैसा की नाम से जाहिर है

Key feature of this pattern (इस पैटर्न के फीचर्स ) :-
- Flat resistance at the Top | हायर प्राइस पर एक रुकावट दिखती है.
- Rising support at the Bottom | सपोर्ट का लेवल धीरे-धीरे बढ़ रहा होता है.
- Touching support or Resistance level atleast 2 or more times | दोनों लाइन (सपोर्ट और रेजिस्टेंस लाइन को कम से कम २ या इससे ज्यादा टच करे.
- Overall Trend of the stock should be Positive | स्टॉक का ट्रेंड बड़े timeframe तेज़ी का हो,
- Entry should be made after the Breaking of Resistance Line | रेजिस्टेंस लाइन को तोड़ने के बाद एंट्री करे
- Target should be double of Low Point and Entry Point | टारगेट आपके एंट्री पॉइंट और लोअर पॉइंट का डबल होना चाइये
- Stop Loss should be the immediate Swing Low from the Entry Point | एंट्री प्राइस से पहले जो स्विंग लौ हो वो आपका स्टॉप लॉस होना चाइये
- Volume should be rising | वॉल्यूम बढ़ना चाइये
Lets study with the help of Real time Example
Click this Link for My Front Page account where on a regular basis I post charts
For Real Learning with the help of Realtime Trades, Click this Link
=========================
Descending Triangle Chart Pattern is a Bearish form of chart pattern, in which we see a falling upward line (or support) and a Flat support Line, Descending Triangle Chart Pattern एक bearish फॉर्म का चार्ट पैटर्न है इसमें हमे एक गिरती हुई रेजिस्टेंस लाइन देखने को मिलती है तथा एक फ्लैट सपोर्ट लाइन मिलती है
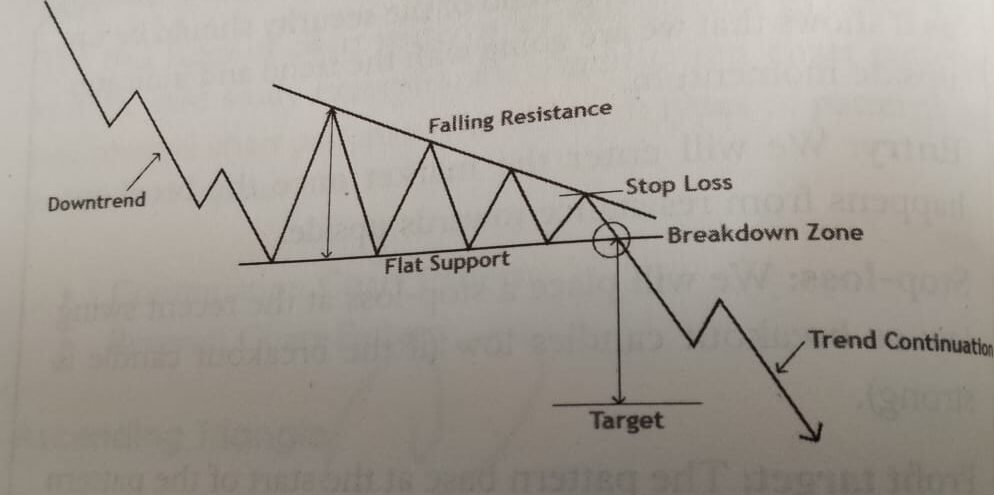
Key feature of this pattern (इस पैटर्न के फीचर्स ) :-
- Flat Support at the bottom | सपोर्ट काफी हद तक समतल हो ,ज्यादा एक्टिविटी न हो ,
- Falling Resistance from the Top | रेजिस्टेंस लाइन धीरे धीरे नीचे आ रही हो ,
- Touching support or Resistance level atleast 2 or more times | दोनों लाइन (सपोर्ट और रेजिस्टेंस लाइन को कम से कम २ या इससे ज्यादा टच करे.
- overall Trend of the security should be down | स्टॉक का ट्रेंड बड़े timeframe मंदी का हो,
- Entry should be made after the Breakdown (Breaking of support Line) | सपोर्ट लाइन को तोड़ने के बाद एंट्री करे
- Target should be double of highest Point and Entry Point | टारगेट आपके एंट्री पॉइंट और हायर पॉइंट का डबल हो
- Stop Loss should be the immediate Swinghigh from the Entry Point | एंट्री प्राइस से पहले जो स्विंग हाई वो आपका स्टॉप लॉस होना चाइये
- Volume should be rising | वॉल्यूम बढ़ना चाइये
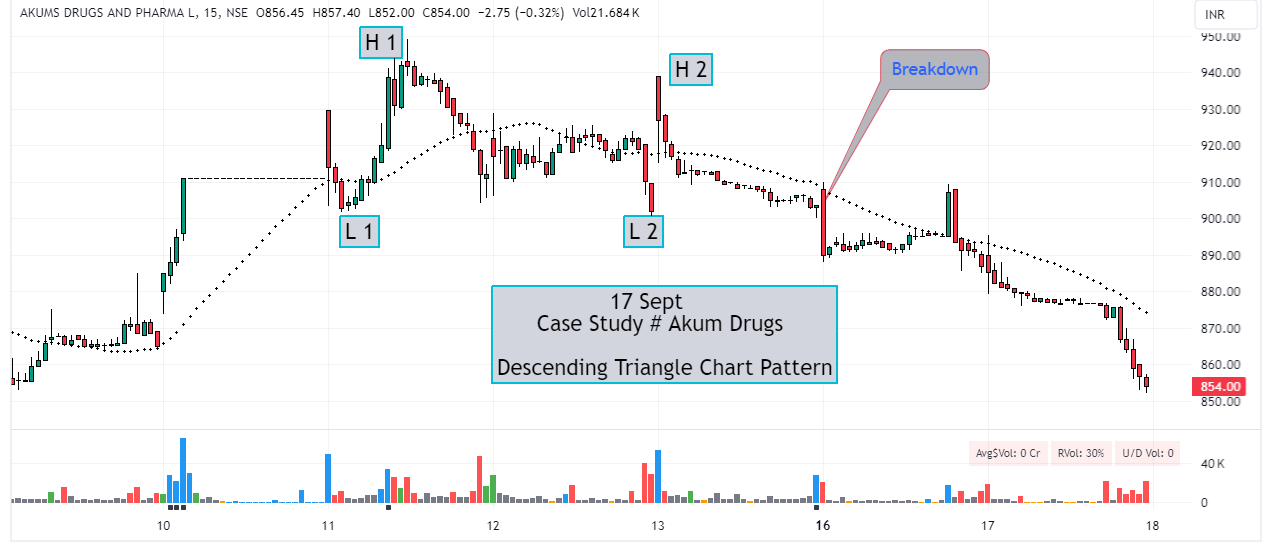
Lets study with the help of Real time Example
===================
Channel as name shows its range between two equal lines (Support/Resistance), broadly it can be defined as extension of above given traingular pattern, It can be further divided into Two Parts Descending Channel & Ascending Channel ( Refer Images)
चैनल जैसे की नाम से जाहिर है यह एक रेंज बना देता है और इन दोनों लाइन्स के बीच प्राइस एक्शन काफी हद तक एक जैसा होता है, यह ऊपर दिए गए traingular pattern के एक्सटेंशन है, इसको २ भागो मे विभाजित किया जा सकता है, Descending Channel & Ascending Channel ( Refer Images)
Ascending Channel

Descending Channel

Key Features of Pattern ((इस पैटर्न के फीचर्स ) :-
Trend # Overall Trend should be clear ( Bullish or Bearish) | बड़े टाइम फ्रेम पर ट्रेंड साफ होना चाइये ( तेजी या मंदी )
Entry # Either after the breach of upper Line (for Long Trade) or after the breach of down Line (for short Trade) | रेजिस्टेंस लाइन के टूटने के बाद एंट्री करे या फिर सपोर्ट लाइन टूटने के बाद
Stop Loss # Swing High for Short Trade and Swing Low for Long Trade | स्विंग हाई मंदी के ट्रेड मे और स्विंग लौ तेजी के ट्रेड मे
Target # should be double of highest Point and Entry Point | टारगेट आपके एंट्री पॉइंट और हायर पॉइंट का डबल हो
Volume # Volume should be rising | वॉल्यूम बढ़ना चाइये
