What is Bullish | Bearish Symmetrical Triangle
Symmetrical Triangle creates a triangular type images on chart before taking final Breakout or Breakdown in favour of original Trend. Symmetrical Triangle further can be categorised into Bullish & Bearish. Symmetrical Triangle पैटर्न मे चार्ट पर एक Triangle इमेज बनता है, इसके बाद स्टॉक एक ब्रेकआउट या ब्रेकडाउन देता है ( जो की ओरिजिनल ट्रेंड के favour मे होता है ), इस चार्ट पैटर्न को दो भाग मे विभाजित किया जा सकता है
I share my chart analysis on Front Page, click the Link for more Details
For Real Learning with Real Trades click this Link….
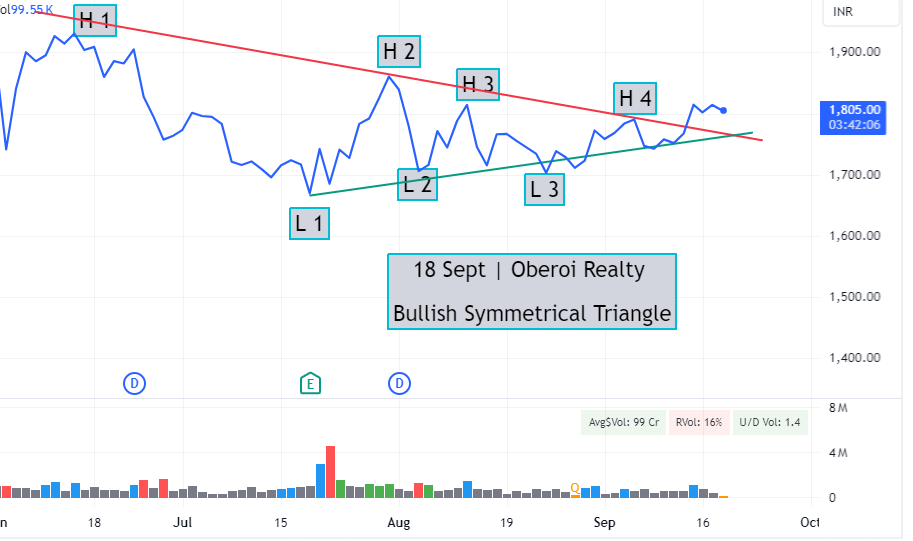
Bullish Symmetrical Triangle is a category of Continuation pattern, this chart pattern is a combination of Support Line & Resistance Line, falling Resistance Line and rising support Line,
यह चार्ट पैटर्न दो लाइन का कॉम्बिनेशन होता है, गिरती हुई रेजिस्टेंस लाइन और बढ़ती हुई सपोर्ट लाइन Refer Chart
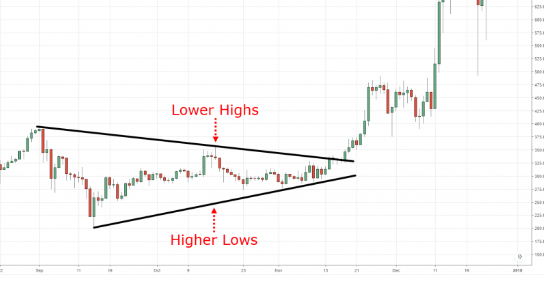
Key Fetures of this Chart Pattern :-
- Overall Trend (on higher time frame) it should be strong | स्टॉक का ट्रेंड बड़े timeframe तेज़ी का हो,
- Entry should be above the falling resistance and above the breakout | रेजिस्टेंस लाइन को तोड़ने के बाद एंट्री करे
- Stop Loss should be below the recent swing Low | एंट्री प्राइस से पहले जो स्विंग लौ हो वो आपका स्टॉप लॉस होना चाइये
- Profit Target should be the double of Base point and Entry Point | टारगेट आपके एंट्री पॉइंट और लोअर पॉइंट का डबल होना चाइये
- After the Breakout volume should increase | वॉल्यूम बढ़ना चाइये
Lets study with Real time Example :-
=====================
Bearish Symmetrical Triangle this chart pattern is a combination of Support Line & Resistance Line, falling Resistance Line and rising support Line, Refer Chart
यह चार्ट पैटर्न दो लाइन का कॉम्बिनेशन होता है, गिरती हुई रेजिस्टेंस लाइन और बढ़ती हुई सपोर्ट लाइन Refer Chart
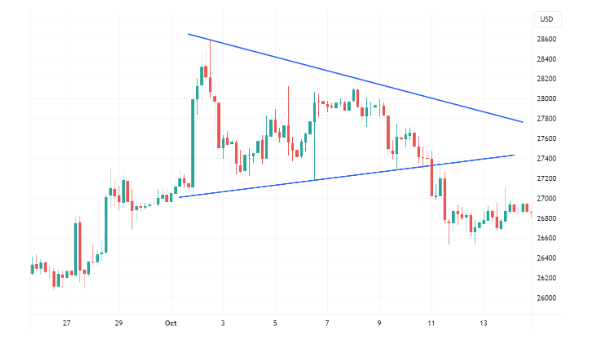
Key Fetures of this Chart Pattern :-
- Overall Trend (on higher time frame) it should be Weak | स्टॉक का ट्रेंड बड़े timeframe मंदी का हो,
- Entry should be below the support and below the breakdown | सपोर्ट लाइन को तोड़ने के बाद एंट्री करे
- Stop Loss should be above the recent swing High | एंट्री प्राइस से पहले जो स्विंग हाई आपका स्टॉप लॉस होना चाइये
- Profit Target should be the double of Top point and Entry Point | टारगेट आपके एंट्री पॉइंट और लोअर पॉइंट का डबल होना चाइये
- As Trading Range shrinks the volume should decline but after the Breakout volume should increase | वॉल्यूम बढ़ना चाइये
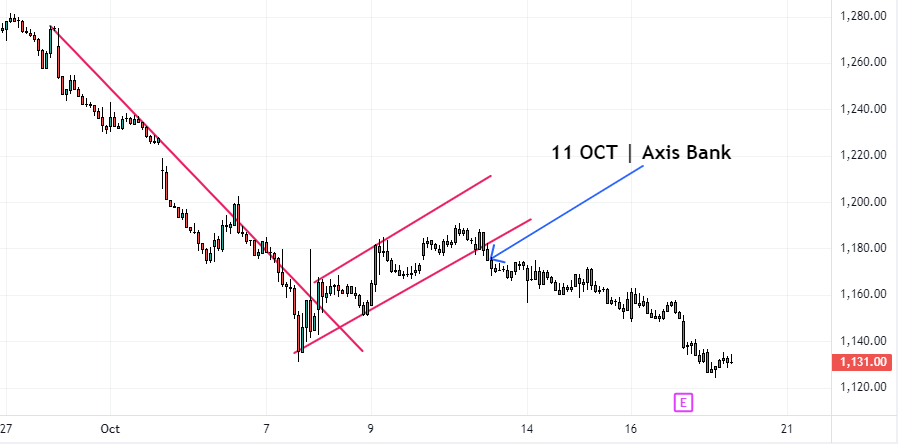
- Real Life Example :-
